
Martin is a partner of a company ATC Legal. He founded the company with his classmate Peter, who left the office eight years ago and moved into the management of the ATC group. Peter didn’t want to completely abandon Martin, so they agreed that the ATC Group would own 30% of ATC Legal and the remaining 70% would be kept by Martin .
So far, Martin just had to look at the bank account to understand how was the business going. It was clear that there were enough projects, and the company was doing well. He never needed to deal with accounting reports, and he considered them to be a waste of time.
However, 2018 was not as successful as expected, and the company incurred a loss. Especially the first half of 2018 was horrible. At that moment, Mary, from the parent company, started to demand explanations. And not only that. He also realized that he needed a much better understanding of his business.
Martin decided to ask his friend John for help: “Hello, I have a project for you.” Martin started a conversation. “Hi, what do you need?” John replied.
Martin continued. “Last year was bad, and I need to understand better what is going on in my company and what I should focus on to remain in green numbers by the end of the year. Also, the headquarters started demanding accounting reports. So I will need some Excel spreadsheets from you. It’s important, and I have to do something about it. I would not like to repeat 2018 – it is clear to me that to become profitable again, I must focus on revenue, but I also want to have more insight into what is happening in the company.”
You certainly haven’t seen a report that thinks for yourself and explains to you how your business is doing.
John was very interested in this project. It was a great opportunity and a way for him to get more contracts from the ATC Group in the future. At the same time, he was experienced enough in managing companies to understand that payroll is the most significant cost item for Martin.
“Martin, I am happy to prepare a report package for you. You’ll need a profit & loss report, but you also have to have a much deeper insight into how your employees are proceeding with their projects. Let’s meet, and I will show you what I can do for you. You certainly haven’t seen a report that thinks for you and explains to you how your business is doing. I am available next Monday. What about you?”
Martin’s schedule was empty that day, so he asked to have the meeting straight away. “I have time on Monday, but if you could show it to me today, it would be great.” “That is no problem, let’s do it.”
After solving the inevitable connection problems, John could show Martin a functional online demo report. The report is available here.
“I use Power BI for all my reporting needs. It’s a cloud-based system from Microsoft, and they have been working hard on it. Our experience shows that it works well.”
John has started to explain each sheet of the report. “You can see a basic overview of the company’s results on the first page. At the top left, you can see a waterfall chart that compares the impact of each section of the profit and loss statement on the total profit. You can see that the payroll is crucial. You also have different filters on the page to manage what you want to see.”
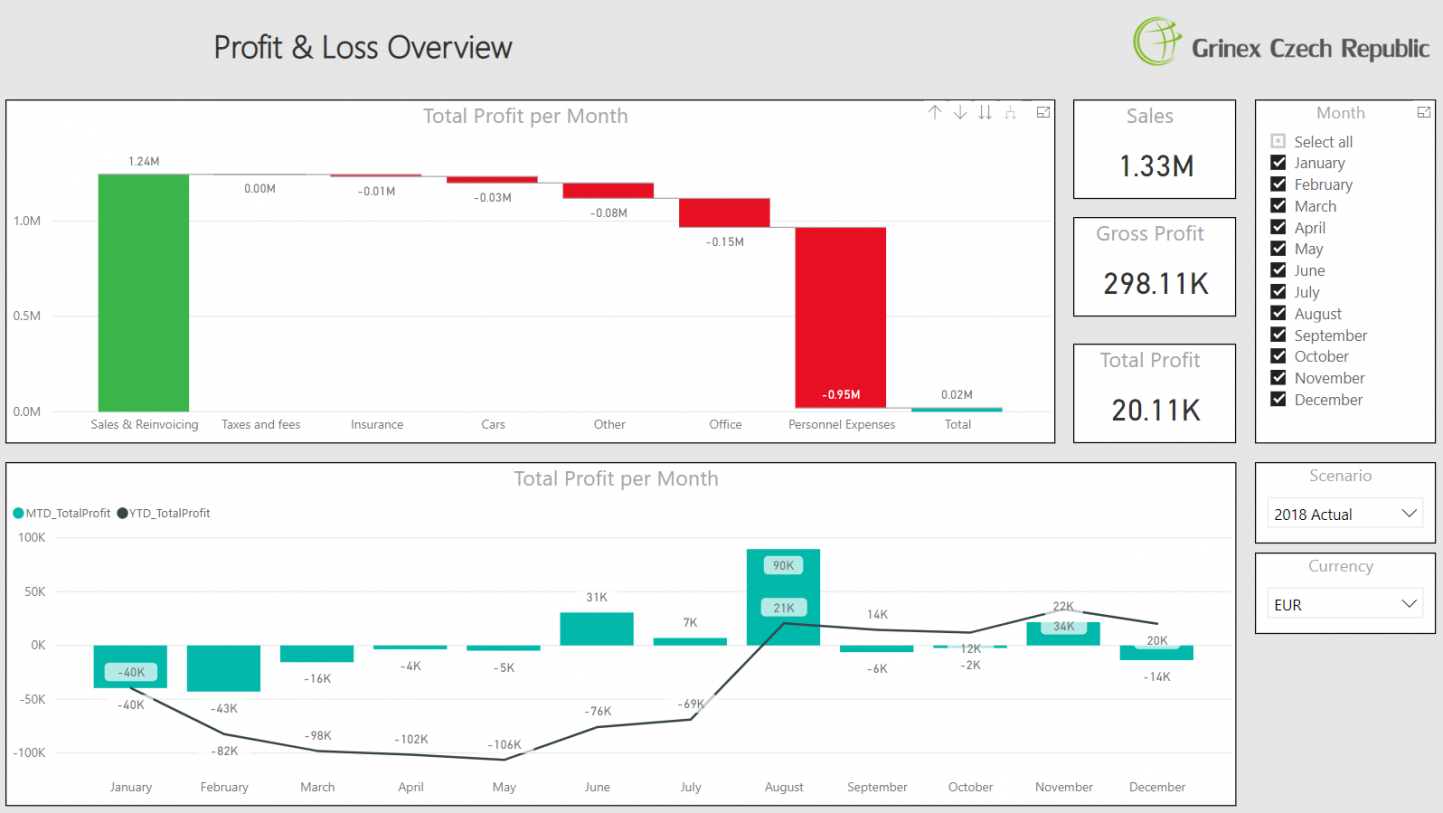
“And what if I want to compare multiple scenarios?” Martin asked.
“If you only want to see the differences in the chart, you would use the report on the second page. The chart shows the differences between the scenarios, both on Month To Date and Year to Date basis. I will also show you other options to compare scenarios in the report.”
Automatic analysis
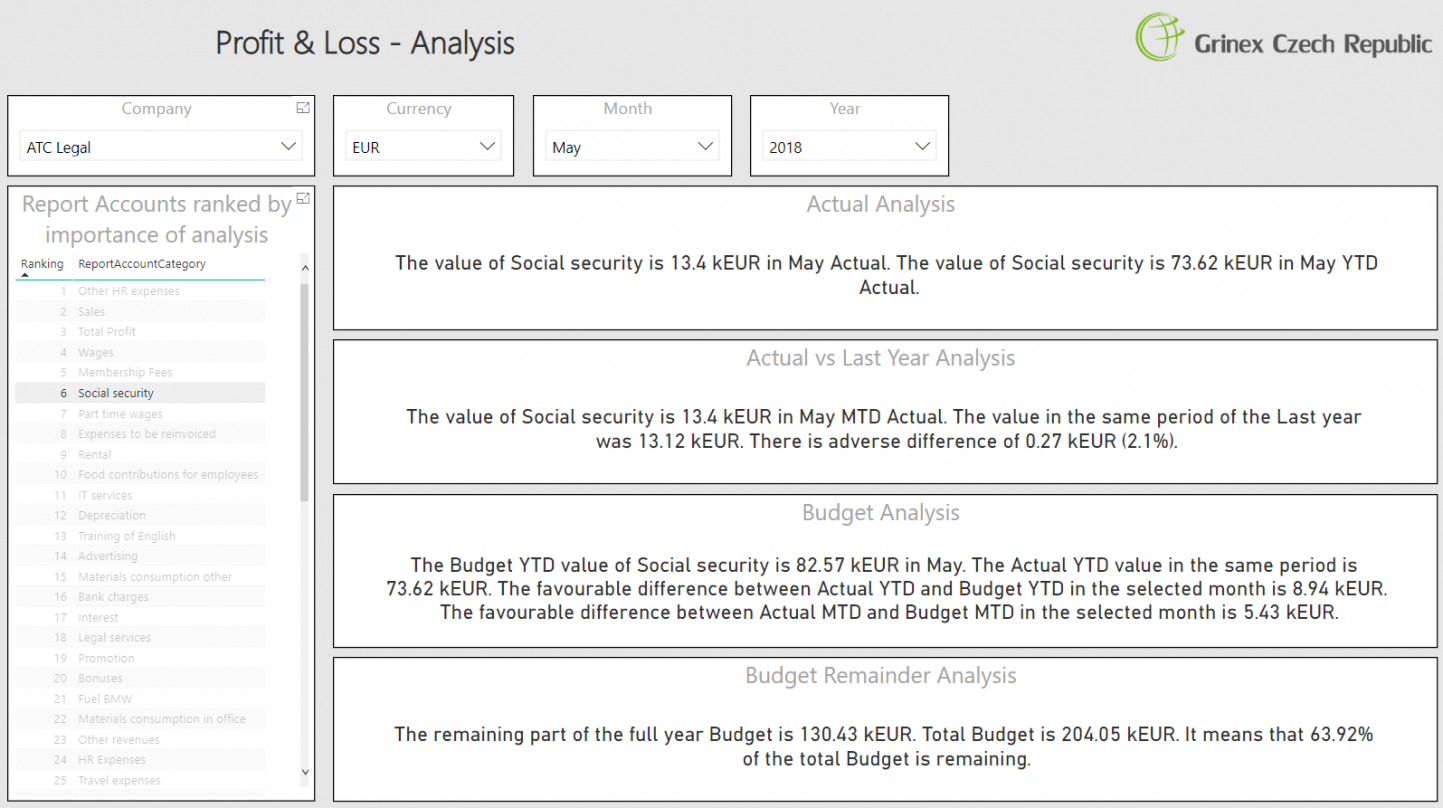
The automatic analysis was another part of the report that John wanted to explain. “And this is the most interesting part: The report automatically determines which accounts in a given month are important and which are the ones that you need to check. The report will also generate short explanations to help you understand what happened in the selected account.”
“But how does the report know what are the important accounts?” Martin asked.
“We have a special algorithm for that. It takes into account multiple parameters. If you have a complicated business with complicated reports, this can alert you to things you wouldn’t otherwise notice.”
Martin was starting to like the system “That’s great. What can it explain to me?”
“It summarizes the amount on a given account, and compares it with other scenarios – for example, it compares actual values with last year values. Besides other things, it also tells you how much you have left in the budget for the month. “
However, Martin was still missing some of the features. “Great. But what if I want to go into full detail of each account and see all the underlying transactions? I will need that from time to time. When I see a big swing, I want to know what has caused it.”
John has often encountered this request. “Yeah, sure. To see the underlying transactions, you click on sheet number six. It will show you all the accounting entries. It’s easier than having to dig deep into your bookkeeping software.”
Comparison of scenarios
“Yeah, you’re right. But you said you would show me how to compare scenarios. I’m interested in that. ”
“There are sheets in the report that do just that. You can find them on sheets 7 and 9. They rely on waterfall charts. They show you the impact of each section of the income statement on the total profit.”
Martin didn’t understand this for the first time. “How exactly does it work? When I look at the waterfall chart, I see the total difference on the right? What about green and red rectangles?”
John continued the explanation. “Rectangles show you the impact of each part of the income statement. When there is a green color, that section has helped you, and when it is red, its impact was negative, or better said, it was worse than in the compared scenario. This functionality is useful when someone asks you why you missed the budget and where were the problems.”

Martin was also interested if it was possible not to use the computer to see the dashboards. “What if I wanted to work with the dashboard on my phone or my tablet?”
“It is possible. Power BI has an app.”
Martin got an overview of what the system can do and how it can help him. At the same time, he realized that he would need a more detailed analysis of the activities of individual employees. “Thanks. I like it so far. However, we still have to look at the other reports you have mentioned.”
“Give me a few days, and I’ll get back to you.”
The report discussed in this post is available here .