
Do you mind that your reports are confusing, their preparation is too complicated and that they are difficult to use? We have a solution for your problems. We can create for you a system customized to your needs which will significantly improve your capabilities when working with accounting information.
What technology are we using?
Power BI is a great tool for working with accounting reports. It is a cloud-based system designed by Microsoft. It will allow you to analyze your data in detail and to present them in visually appealing form. All of that can be done in real time from one place. Thanks to a wide array of visualizations, Power BI can satisfy even the most demanding users.
A great feature of Power BI is its integration with Microsoft Office. Power BI will allow you to present data from various sources, including the data stored in Excel. Power BI reports can be shared with your colleagues and they can be accessed from your computer, from Power BI website or from an app.
How can Power BI help you
All charts in a visualization are linked and this enables Power BI to react to your requests.
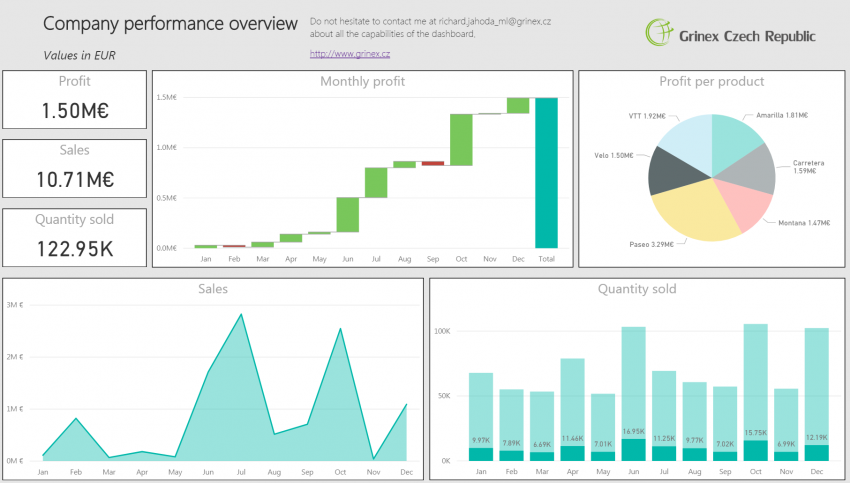
The next picture shows you how useful this functionality can be. The picture is showing four types of charts. The most interesting chart is the one with profit per month. It is a waterfall chart which is showing the gradual development of the profit. You can see just from a quick glance that the product Velo has achieved a small loss in September. This loss was more than compensated by October, which was the most profitable month. The bottom right chart is showing unequal distribution of product Velo quantity sold.
You can apply a filter to all charts by clicking at product Velo in the pie chart. All visualizations are then showing only data related to the product Velo. Filters can be applied not only to charts but also to other visualization such as tables. You can also combine multiple filters.
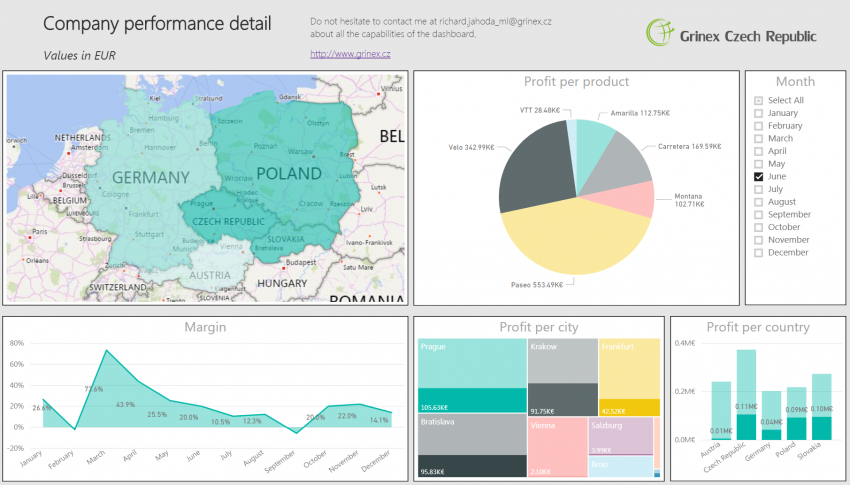
Next picture is showing a combination of a filter for the particular month together with a filter for certain area in the pie chart. The resulting report is showing only data for product Velo and only data for June.
All the pictures so far have shown only basic indicators such as profit or volume of sales. But it is possible to calculate various other indicators. Since our reports are made for the particular client, we are able to customize the reports to show any KPI or use any indicator from the financial analysis.
Power BI allows you to perform detailed analysis as well as a high-level overview of main indicators. The strength of Power BI is shown when both these approaches are combined: the system then allows a drill through from basic overview all the way to the most detailed data.
Reports created in Power BI can be used either in a program installed on your computer or on a website. Since the website version is not limited in functionality, we consider it to be the preferred option of working with Power BI. Power BI also has nice and useful app.
Live version of online dashboard can be tested below:
System for Questions and Answers
Very interesting feature of modern visualization tools is an ability to communicate with users via the chat interface, where user types a question about the data and the system offers a chart that answers the question.
Power BI contains this functionality as well, but it currently supports only questions in English. This functionality requires some getting used to but it is capable of bringing very quick insight into the performance of the company.
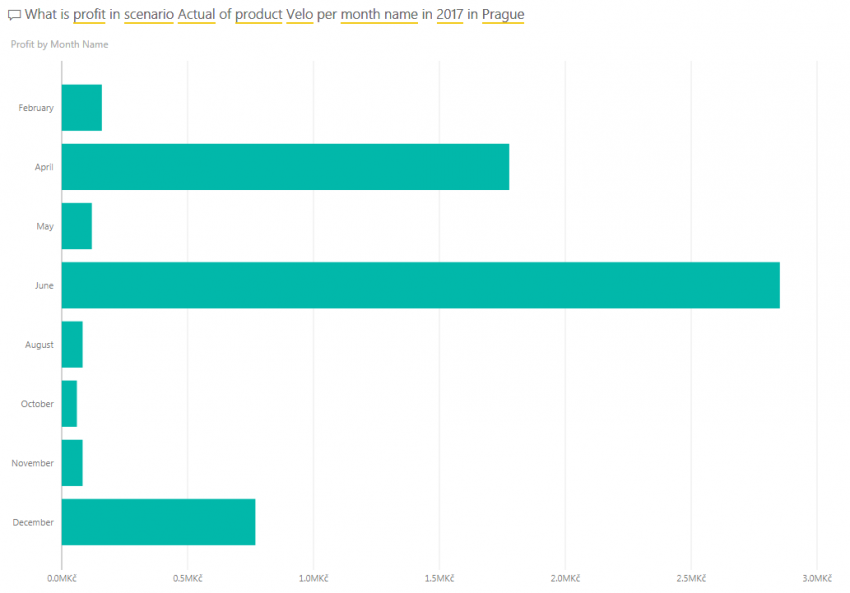
The picture below shows how Power BI Q&A reacted to the question „What is profit in scenario Actual of product Velo per month name in 2017 in Prague“:
Price of Power BI
A big advantage of Power BI is its very reasonable price. Microsoft has decided to use very accessible pricing policy, which sets Power BI apart from Tableau or QlikView. Fully functional version of Power BI but without the support of collaboration is available for free. In order to be able to share reports with other users, you need to use Power BI Pro which costs 10 USD per month per user. I believe that it is good value for money. If you would like to start using Power BI it is always important to keep in mind that it requires reliable data model. Data quality in the company must be taken into consideration as well when planning Power BI implementation.
If you like capabilities of Power BI and you would like a consultation on how it can help you and your company, do not hesitate to contact me on richard.jahoda_ml@grinex.cz.